Toronto's Early Voters Are Not Spread Evenly
Downtown accounts for 40.1% of Toronto's advance votes but 35.2% of electors. The ward-level figures show where early participation is strongest, and what remains unknown before October 26.
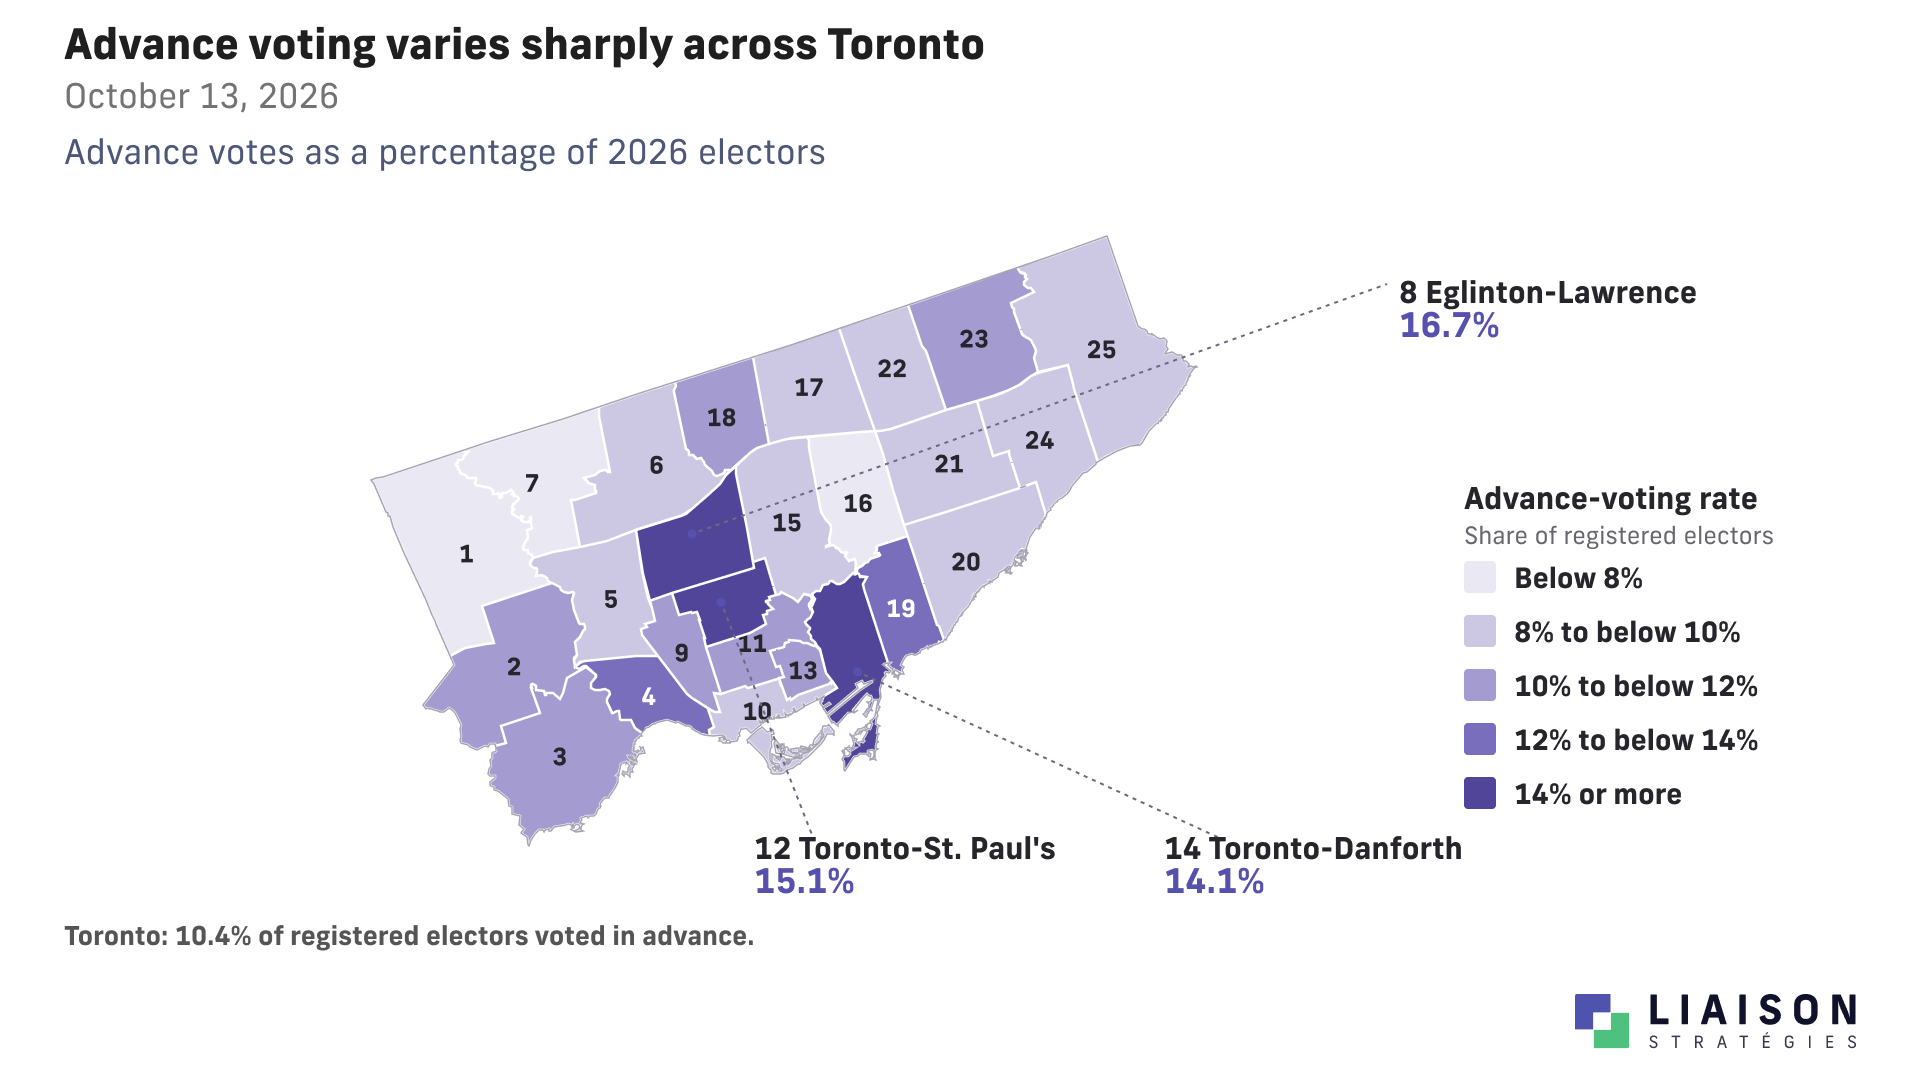
About 223,000 people have already voted in Toronto's municipal election. Downtown accounts for four in ten of those advance votes, even though it has just over a third of the electors on the city's voters' list. And the ward with the highest early-voting rate is Eglinton-Lawrence, where roughly one in six electors has already voted.
That is a useful start to understanding the electorate taking shape before October 26. The citywide increase is substantial, but it is not happening at the same pace everywhere. For campaigns still trying to get their supporters to vote, the differences are worth paying attention to.
The City announced about 223,000 advance voters, up about 72% from roughly 130,000 in the 2023 mayoral by-election. That is a substantial increase since the last time Torontonians chose a mayor.
Toronto has more electors than it did when Olivia Chow was first elected, so some increase would be expected. But list growth does not come close to explaining all of this. Using the 2026 electors list, roughly 10.4% of electors have voted in person in advance, compared with 6.7% using the 2023 election's final list.
Downtown has a larger share of the early vote
Downtown accounts for 40.1% of the ward total. Its share of the August voters' list is 35.2%.
That means Downtown is supplying a larger share of the people who have already voted than its share of registered electors would suggest. Scarborough is supplying a smaller share: 19.1% of advance votes, compared with 21.3% of electors. North York accounts for 27.8% of the early vote and 29.8% of electors. Etobicoke is closer to its share of the list, at 13.0% of advance votes and 13.6% of electors.
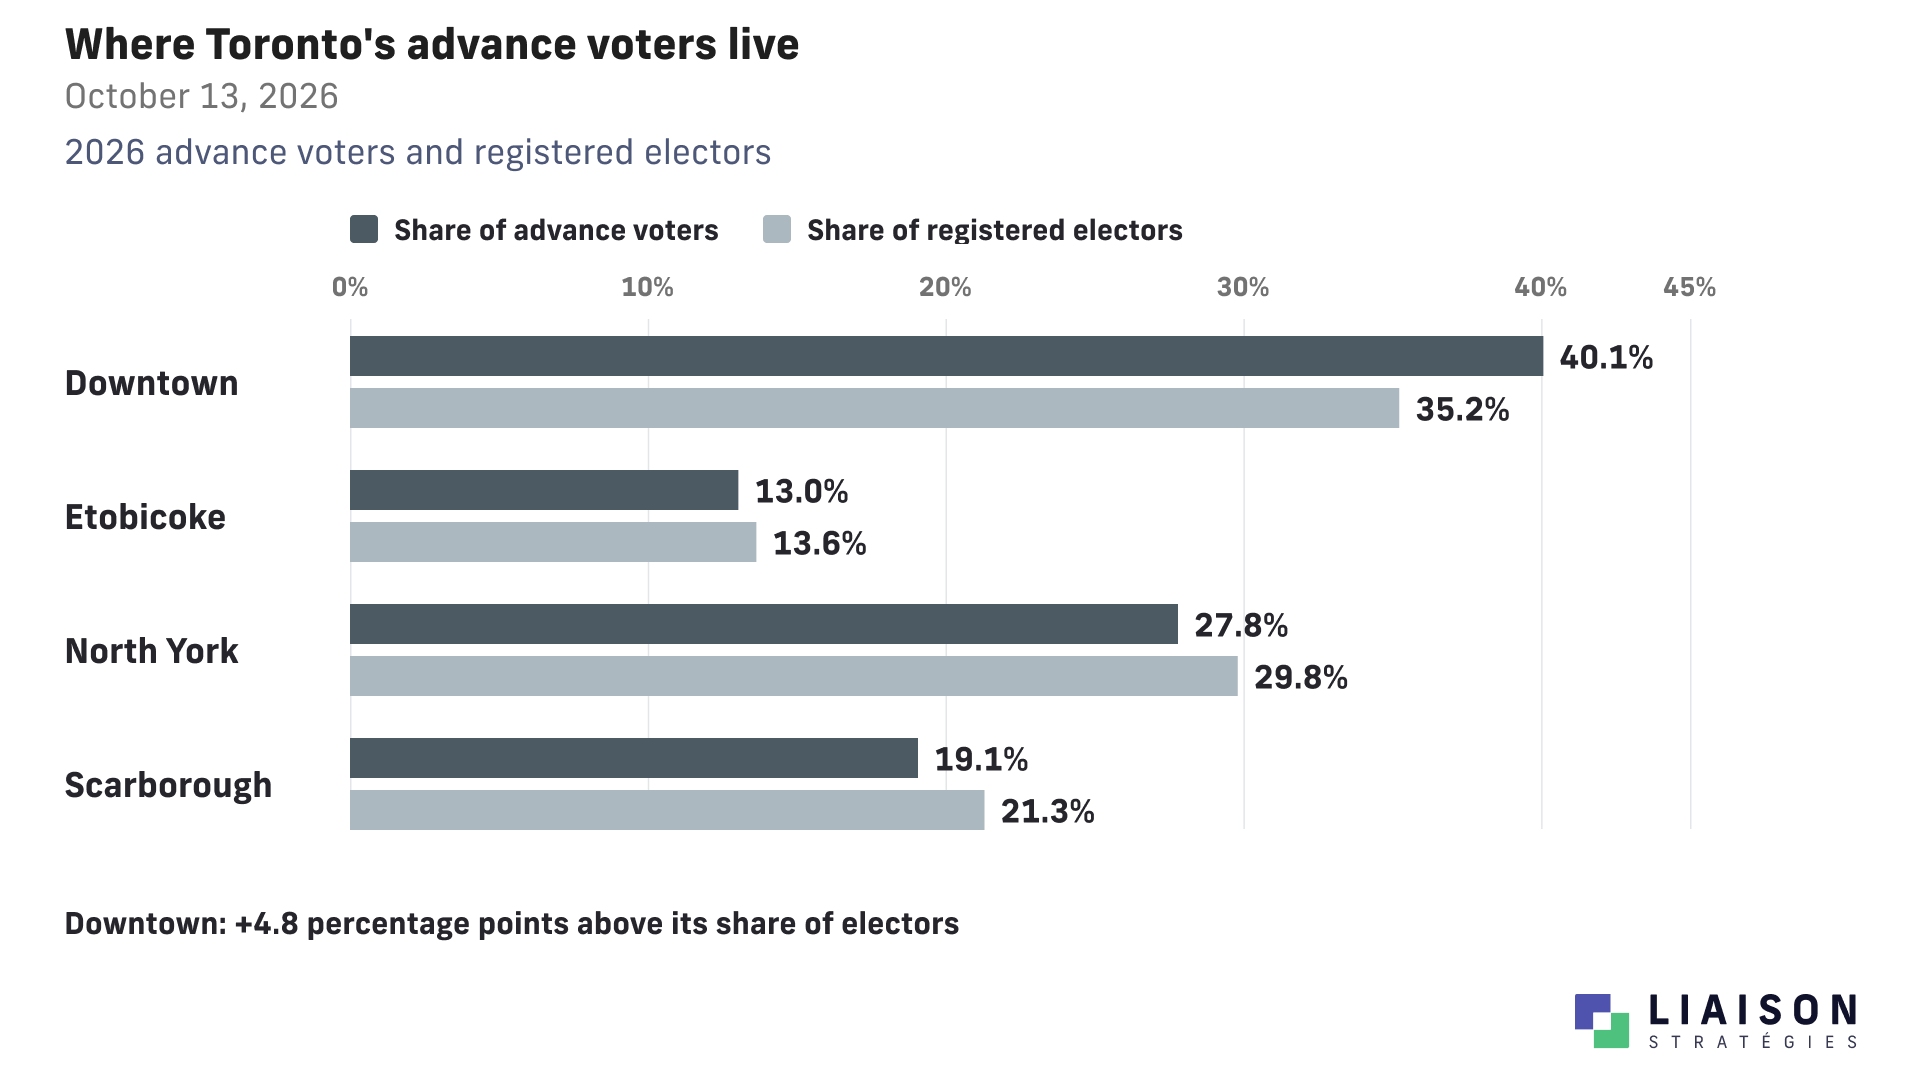
These percentages describe people who have already voted. They do not tell us how the whole electorate will be divided on election night. Scarborough residents who plan to vote on October 26 have not missed their chance to count.
However, compared with the City's 2023 ward summary, Downtown's share is slightly smaller: 40.1% this time, compared with 41.0% in the last mayoral race. Scarborough's share has fallen from 21.2% to 19.1%. North York has the largest increase in share, from 24.9% to 27.8%, while Etobicoke is essentially unchanged at 13.0%.
While we don't know how all the early votes were cast, given that Olivia Chow's strongest region is downtown, this is generally bad news for her campaign, though to be fair, downtown has only dropped by a point.
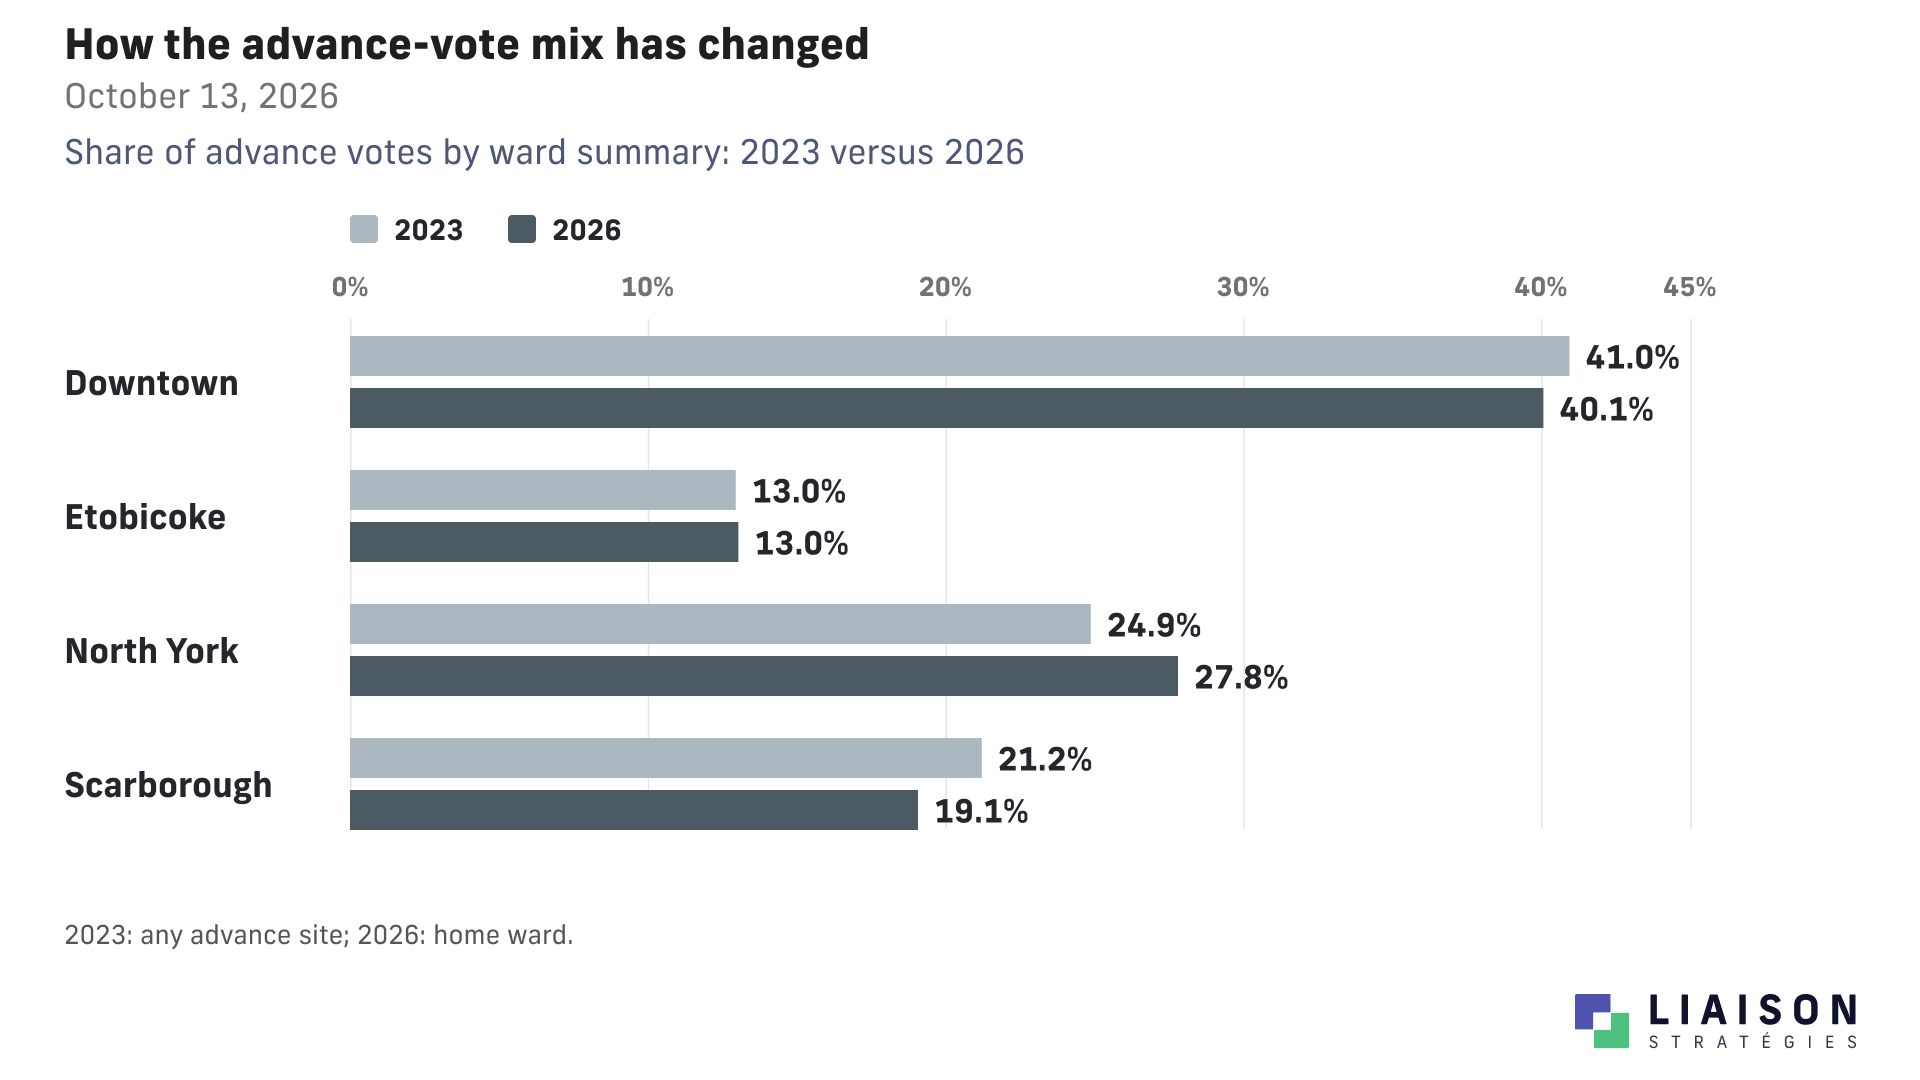
All four regions have more advance votes than in 2023. North York's count is up about 92%, Etobicoke's about 73%, Downtown's about 68% and Scarborough's about 54%. Those increases do not adjust for changes in the number of electors in each region.
Downtown still accounts for more of the early vote than its share of electors, but it is not taking a larger share than in the last mayoral election's ward summary and is slightly down. North York is the region accounting for a larger part of that comparison. And Scarborough's smaller share does not mean fewer people there have voted: its advance count has grown considerably too.
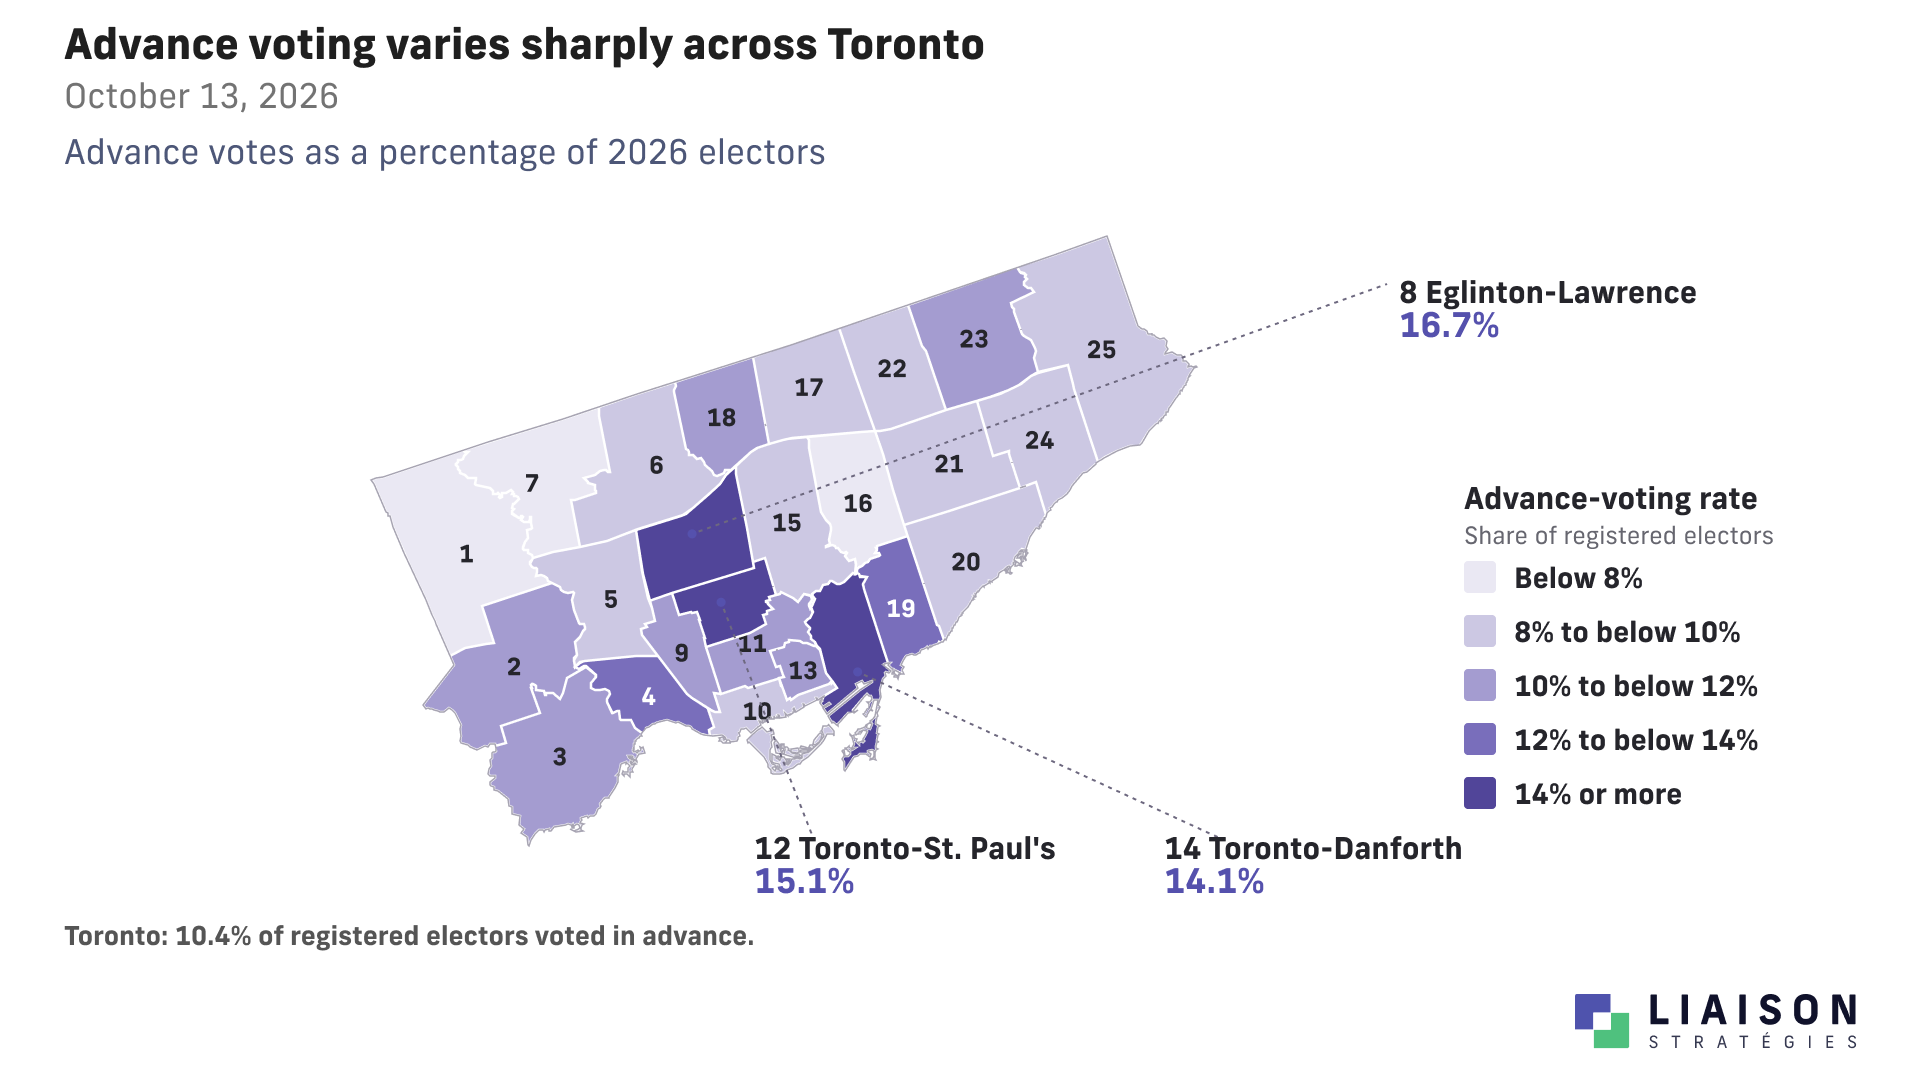
Eglinton-Lawrence is the standout
About 15,000 people voted early in Eglinton-Lawrence, the highest count of any ward in the ward table. That is 16.7% of its electors on the August list.
Toronto-St. Paul's follows at 15.1%, then Toronto-Danforth at 14.1%, Parkdale-High Park at 12.9% and Beaches-East York at 12.7%. Four of those five wards fall in our Downtown grouping. Eglinton-Lawrence is in North York.
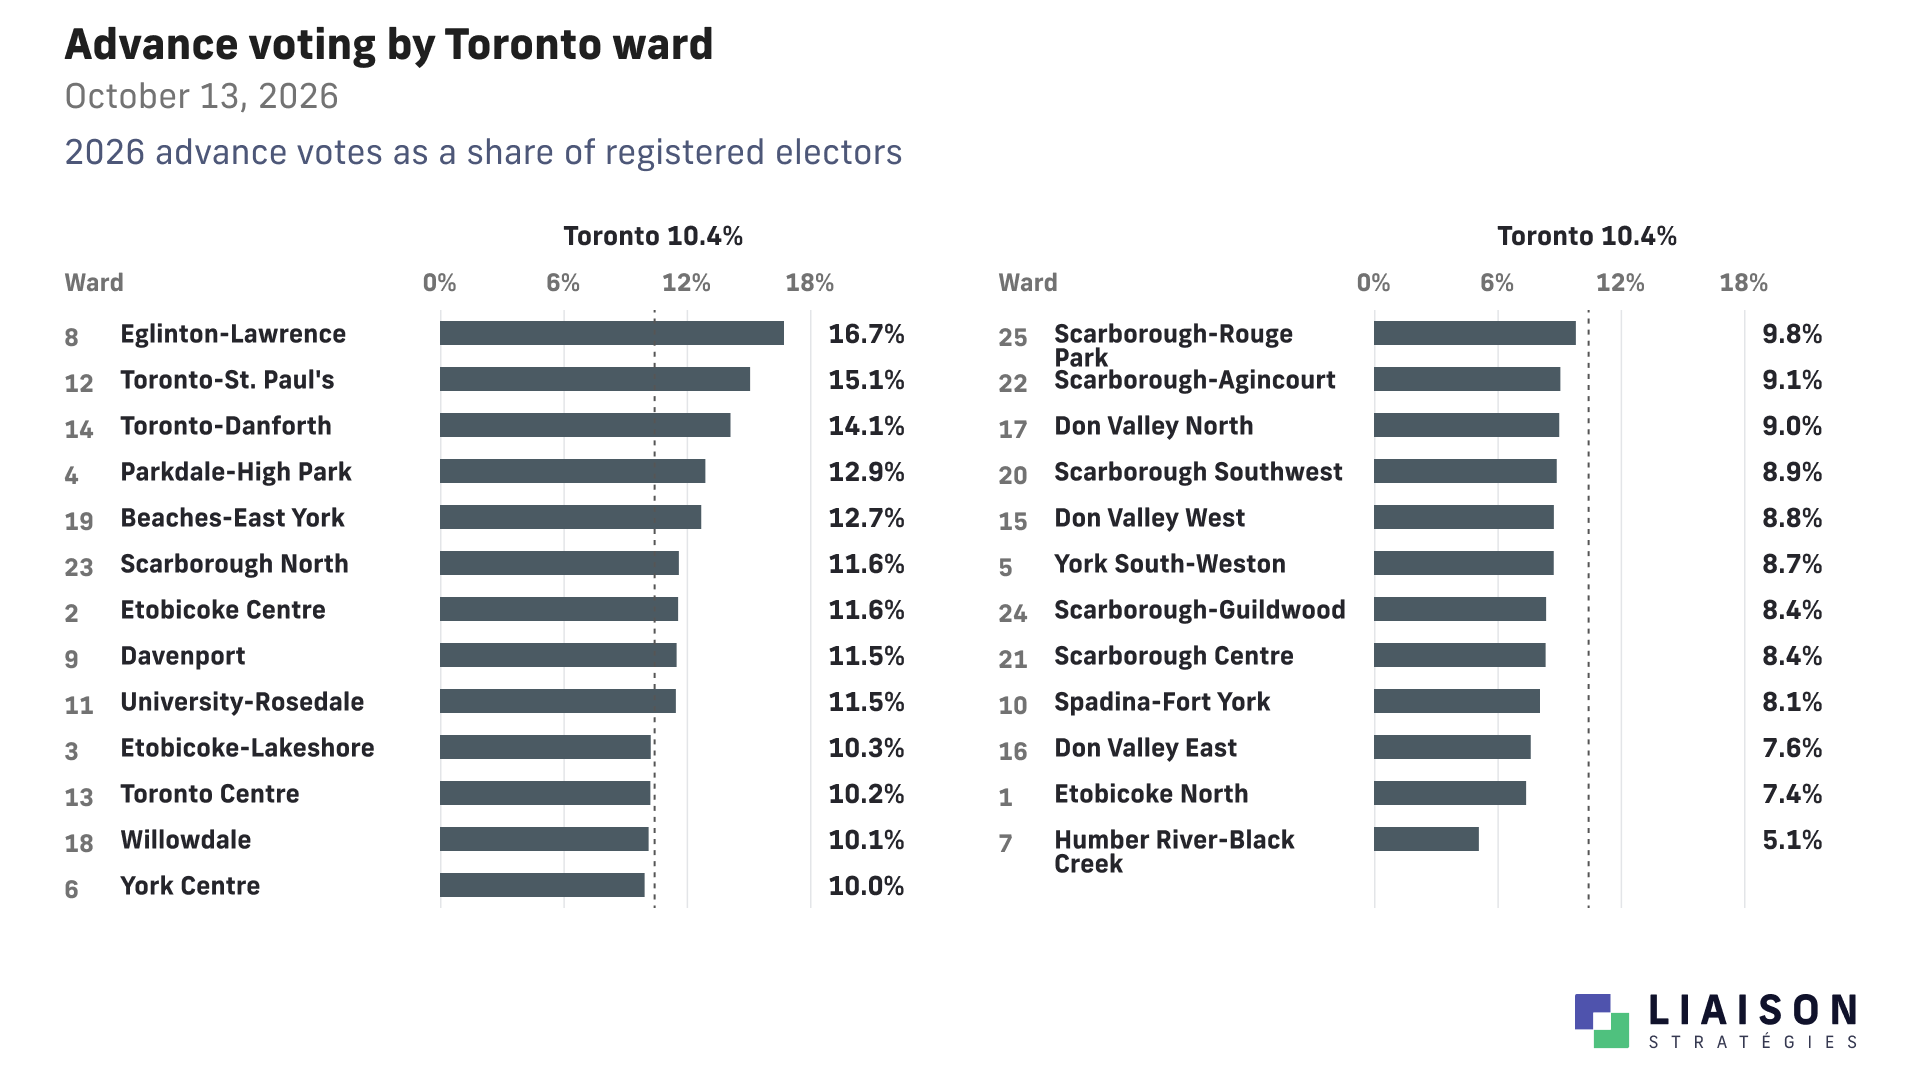
The differences within North York are particularly useful. Humber River-Black Creek has the lowest advance-voting rate in the city, at 5.1%. Eglinton-Lawrence's rate is more than three times as high.
Etobicoke has differences of its own. Etobicoke Centre is at 11.6%, compared with 10.3% in Etobicoke-Lakeshore and 7.4% in Etobicoke North. In Scarborough, Scarborough North leads at 11.6%, while Scarborough Centre is at 8.4%.
More voters does not always mean a high voting rate
Toronto Centre and Spadina-Fort York are worth a closer look, particularly after our analysis of Toronto's growing voters' list.
Toronto Centre recorded about 10,400 advance votes, up roughly 70% from 2023. But that is 10.2% of the ward's electorate, close to the citywide 10.4% rate. Toronto Centre accounts for 4.7% of advance votes and approximately 4.7% of electors. It is not disproportionately driving Downtown's larger share.
Spadina-Fort York recorded about 10,000 advance votes, up roughly 67% from 2023. Its early-voting rate is only 8.1%, below the citywide rate.
That is why I would look at both the count and the proportion of electors who have voted. A fast-growing ward can produce a very impressive increase in ballots without becoming a particularly high-participation ward.
Spadina-Fort York's final turnout in 2023 was about 33.5%, below the citywide 37.2%. There are more early voters this time, but October 26 will tell us whether the ward closes that participation gap.
David Valentin is a Principal at Liaison Strategies